Stout is pleased to present our 1H 2025 Energy Industry Update. Through our team’s ongoing dialogue with leading market participants, highly relevant and recent transaction experience, and analysis of key trends and broader market health, we have summarized a few takeaways below, followed by an in-depth discussion of industry trends, drivers of value, public market performance, and recent mergers and acquisitions activity.
We hope that you find this report helpful and that it serves as a valuable resource to you in staying up to date on the market. We look forward to assisting our clients and encourage you to contact us directly if you would like to discuss our perspectives on current market trends, potential M&A opportunities, or our relevant advisory/valuation experience.
The energy sector offers numerous attractive characteristics that tend to pique interest from investors during times of economic volatility. Well-capitalized operators that embrace ongoing market trends are positioned to capture incremental share by acquisition and expansion into new geographies, ultimately leading to outsized valuation multiples from investors. As our clients steer through the evolving energy landscape, our expertise offers invaluable insights and strategic guidance to seize opportunities and mitigate risks.
Strong expected load demand in the Independent Power Producer (“IPP”) and the Utility sectors continues to propel strong M&A activity. Announcements from Constellation/Calpine, NRG/LS Power, ENI/Ares, and KKR/PSP’s purchase of a stake in AEP’s transmission network highlight a busy year. Key drivers of consolidation include forecasted load demand growth driven by digitalization-related demand. Also, the Federal Energy Regulatory Commission’s Order No. 2023 adopted reforms to reduce backlogs for projects seeking to connect to the transmission system with an aim to improve certainty in the interconnection process.
Public market equity valuations in the solar industry experienced substantial market volatility over the past quarter leading up to the announcement of the signed OBBB based on the assumed adjustments to provisions of the IRA, particularly pertaining to ITCs for solar projects. Following signature of the bill, distributed generation rooftop solar companies like Sunrun (NASDAQ: RUN), Enphase (NASDAQ: ENPH), and SolarEdge (NASDAQ: SEDG) RUN and SEDG market valuations have rebounded given several tax credit exemptions which survived, including Section 48 credits for PPAs through 2028 and other unexpected concessions in the signed Bill.
Recent legislative actions have increased headwinds for solar and wind development, but natural gas production, along with modular nuclear, hydro and geothermal facilities, are expected to fill a larger proportion of forward dispatch. Wood Mackenzie’s discussions post-OBBB, have indicated that natural gas facility overnight costs are now approximately $2,200 per MW and cash outlays to begin development have become increasingly necessary. Natural gas storage continues to build, with five straight weeks of injections topping 100 BCF. As the market enters the higher-demand Summer months, storage injections are expected to slow. The longer-term outlook on natural gas pricing remains bullish, with winter 2025 pricing remaining well ahead of 2024.
According to the International Energy Agency (“IEA”), global oil demand growth is projected to decline from 990,000 barrels per day to 700,000 barrels per day for the remainder of the year (lowest growth since 2009 with the exception of 2020), while world oil supply is expected to increase by 2,100,000 barrels per day in 2025 and 1,300,000 barrels per day in 2026 after recent announcements.
According to Wood Mackenzie’s 2025 Power Market Outlook, Natural Gas continues to significantly benefit from federal policy shifts after the 2024 presidential election. In 2024, the market saw a material increase in capacity ordered across North America, growing by approximately 146.0 percent from the previous year, and this was the largest increase observed since 2015. Gas turbine orders in particular increased by 36.0 percent, driven primarily by the need to mitigate rising energy costs propelled by strong load demand and intermittent renewable supply (demand has been so strong, the market has experienced a severe delay in order delivery given the backlog). In addition, federal policy toward LNG export has been deemed more supportive than previous administrations, which has translated into a forecasted doubling of LNG export volumes to approximately 22 billion cubic feet per day (“bcf/d”) by 2027 from projects currently under construction with additional increases expected from projects that are pre-FID.
As a result of the policy shifts, a wave of consolidation in the Natural Gas IPP space continues to gain momentum. The most recent announcement of NRG’s $12.0 billion purchase of LS Power’s generating assets represents a high-profile case in point. NRG’s acquisition of 13 gigawatts (“GWs”) of natural gas capacity and 6 GWs of C&I virtual platform represents an acquisition multiple of 7.5x 2026 Enterprise Value/EBITDA or approximately 50.0 percent of estimated new build cost. Further, the acquisition economics exceed NRG’s stated unlevered, pre-tax hurdle rates of 12.0 – 15.0 percent. The company will further target $3.7 billion of targeted debt reduction, post acquisition, which is expected to close in the first quarter of 2026. NRG’s purchase enhances the company’s flexibility to meet shifting load demand while accelerating growth and increasing the company’s long-term EPS growth rate from 10.0 percent to over 14.0 percent.
The "One Big Beautiful Bill" (OBBB), signed into law on July 4, has significant implications for the U.S. solar and wind industries, marking a sharp pivot from the incentives of the Inflation Reduction Act (IRA). The OBBB accelerates the phase-out of key tax credits for renewable energy, such as the 45Y and 48E credits, which will only apply to wind and solar projects placed in service by the end of 2027 or under construction by mid-2026. Additionally, the Treasury Department is set to tighten the criteria for what qualifies as “construction,” further complicating project eligibility. These changes are expected to reduce total tax credit availability to the renewable energy sector by $500 billion over the next decade, significantly undermining the financial viability of new wind and solar developments. Analysts predict that wind and solar capacity growth will slow dramatically, with installations over 2025–2030 projected to be 100 GW lower than under the IRA framework. Onshore wind and solar installations may experience a short-term surge as developers scramble to meet the newly imposed deadlines, but long-term investment is forecasted to drop significantly — 17% lower for solar on a 10-year view compared to prior forecasts.
Prior to the passing of the OBBB, the EIA projected that 93% of new capacity in 2025 would come from wind, solar, or battery storage. If these forecasts hold, the Stout team foresees significant energy market implications. Reduced renewable investment could constrain supply, complicating efforts to meet rising demand, particularly from AI-related datacenters. Additionally, replacing renewables with natural gas, hydro, or modular nuclear facilities would take longer, as these projects typically require around three years to become operational compared to one year for renewables. This delay could drive up cost of new entrant prices, sustaining higher costs for consumers.
The first half of 2025 has seen the energy sector navigate a complex landscape of record clean energy investment driven by electrification trends and surging data center demand yet also grapples with critical mineral supply chain vulnerabilities and lagging grid infrastructure that threaten electricity security. This drive towards cleaner energy contrasts with nuanced hydrocarbon market dynamics, where oil prices experienced volatility (influenced by OPEC+ strategy and slowing U.S. shale) and natural gas prices rose sharply on strong LNG exports despite high storage. Overall, while a bullish outlook for electricity demand persists, significant policy uncertainty (like proposed changes to tax credits and foreign entity restrictions) looms large, impacting capital allocation and the long-term viability of both traditional and renewable energy projects.
The energy sector has grappled with critical themes beyond typical market forecasts. The "Age of Electricity" is accelerating, with immense demand from data centers and AI operations driving record electricity consumption. This surge highlights the urgent need for massive grid infrastructure upgrades, which are currently lagging due to lengthy permitting and tight supply chains for essential components like transformers. Simultaneously, critical mineral supply chain resilience remains a significant concern, as diversification efforts are proving too slow to address market concentration and long-term sourcing risks. The sector is also navigating the complex interplay of emerging technologies: while global electrolyzer capacity for hydrogen has doubled, North America’s low-carbon hydrogen share is expected to decline by 2030 due to policy shifts and funding cuts. Meanwhile, Carbon Capture, Utilization, and Storage (“CCUS”) projects are achieving operational milestones yet still face challenges in scaling bespoke equipment markets.
Energy analysts estimate LNG to play a larger role in establishing American energy dominance under President Trump’s administration. On March 19, 2025, President Trump announced intentions to increase American oil & natural gas exports by up to 3 million barrels per day. Given the United States’ access to ample natural gas reserves, LNG has emerged as a clear contender to allow the United States to close the trade deficit with trading partners per President Trump’s vision. LNG’s dominance in today’s energy markets is predicated on natural gas remaining a lower cost fuel relative to alternatives. Key drivers to preventing significant increases in natural gas depends on permitting and critical infrastructure to be developed for the natural gas pipelines.
Equity research and market analysis for 1H 2025 reveal diverging trends for oil and natural gas prices. J.P. Morgan Research projects Brent crude to average $66/bbl in 2025, falling to $58/bbl in 2026, driven by a prevailing view that global supply will outpace demand. This includes an earlier-than-expected OPEC+ production increase of 411 kb/d for July 2025 as part of a flexible, revenue-maximizing strategy that may see them accelerate output. Meanwhile, U.S. shale oil production growth is anticipated to slow due to lower prices and rising drilling costs (up 4.5% in 2025, with steel piping costs surging 40%). This could partially offset increased OPEC+ output, contributing to projected inventory builds by mid-year. For natural gas, despite regional softness (e.g., Canadian AECO), robust LNG export growth, particularly from new North American liquefaction projects, and strong demand from the power sector are key drivers. Concerns over U.S. tariff policy and potential recessionary pressures remain key downside risks, with analysts eyeing a “market reset” for oil prices in the 2025-2026 timeframe.
In March 2025, the Federal Reserve held the federal funds rate target range unchanged at 4.25% to 4.50%. The Federal Open Market Committee Open Market Committee (“FOMC”) revised its economic growth outlook downward and raised its inflation projection, citing the impact of heightened macroeconomic conditions related to tariffs and trade wars. As a result, the market now expects a slower pace of rate cuts in 2025, with greater uncertainty surrounding the current economic climate and outlook. CME FedWatch currently forecasts 1 – 2 rate cuts with ~70% probability.
According to UBS Credit Research, U.S. direct lending volumes have declined in Q1 approximately 30% y/y from ~$50 bn to ~$35 bn in deal volume. UBS indicates the lower direct lending activity is directly correlated to the lower M&A activity among financial sponsors.
Amid the softer deal activity, overall private credit dry powder remains stable at ~30% of AUM for direct lending funds, offering ample liquidity to sponsors seeking private credit financing. However, UBS reports that fundraising for direct lending funds has witnessed softer demand from capital allocators given the softer deal volumes.
Aside from a brief period of tightening in April 2025 due to tariff uncertainty, middle-market spreads have trended toward tightening over the past six months since the Fed began cutting rates in Fall 2024. The tightening in middle-market spreads and modest widening in other broad market spreads (oil & gas, utilities, etc.) reflects investor demand for yield, as borrowing costs show signs of declining in the wake of the late 2024 Fed rate cuts. Further, reignition of inflation worries has increased investor demand for higher yield paper to protect from principal loss due to inflation.

While the total number of funds raised in 2024 experienced softer volumes compared to 2023, the average $ fund size per fund raised increase in 2024. In 2024, a total of approximately 110 funds were raised with total proceeds of approximately $130 billion compared to 2023 with 170 funds raising total proceeds of $120 billion. This represents an increase in average fund size from $0.7 billion per fund to $1.2 billion per fund, indicating a 70% increase in average fund size as LPs continued to demonstrate preference toward larger funds.
YTD 5/31/25 total funds raised of approximately $80 billion represents 60% of total funds raised in 2024, implying 2025 is currently on pace to outperform 2024 total funds raised (assuming no seasonality in fundraising). However, as mentioned previously, the pace of actual capital deployment continues to decline given market uncertainty.
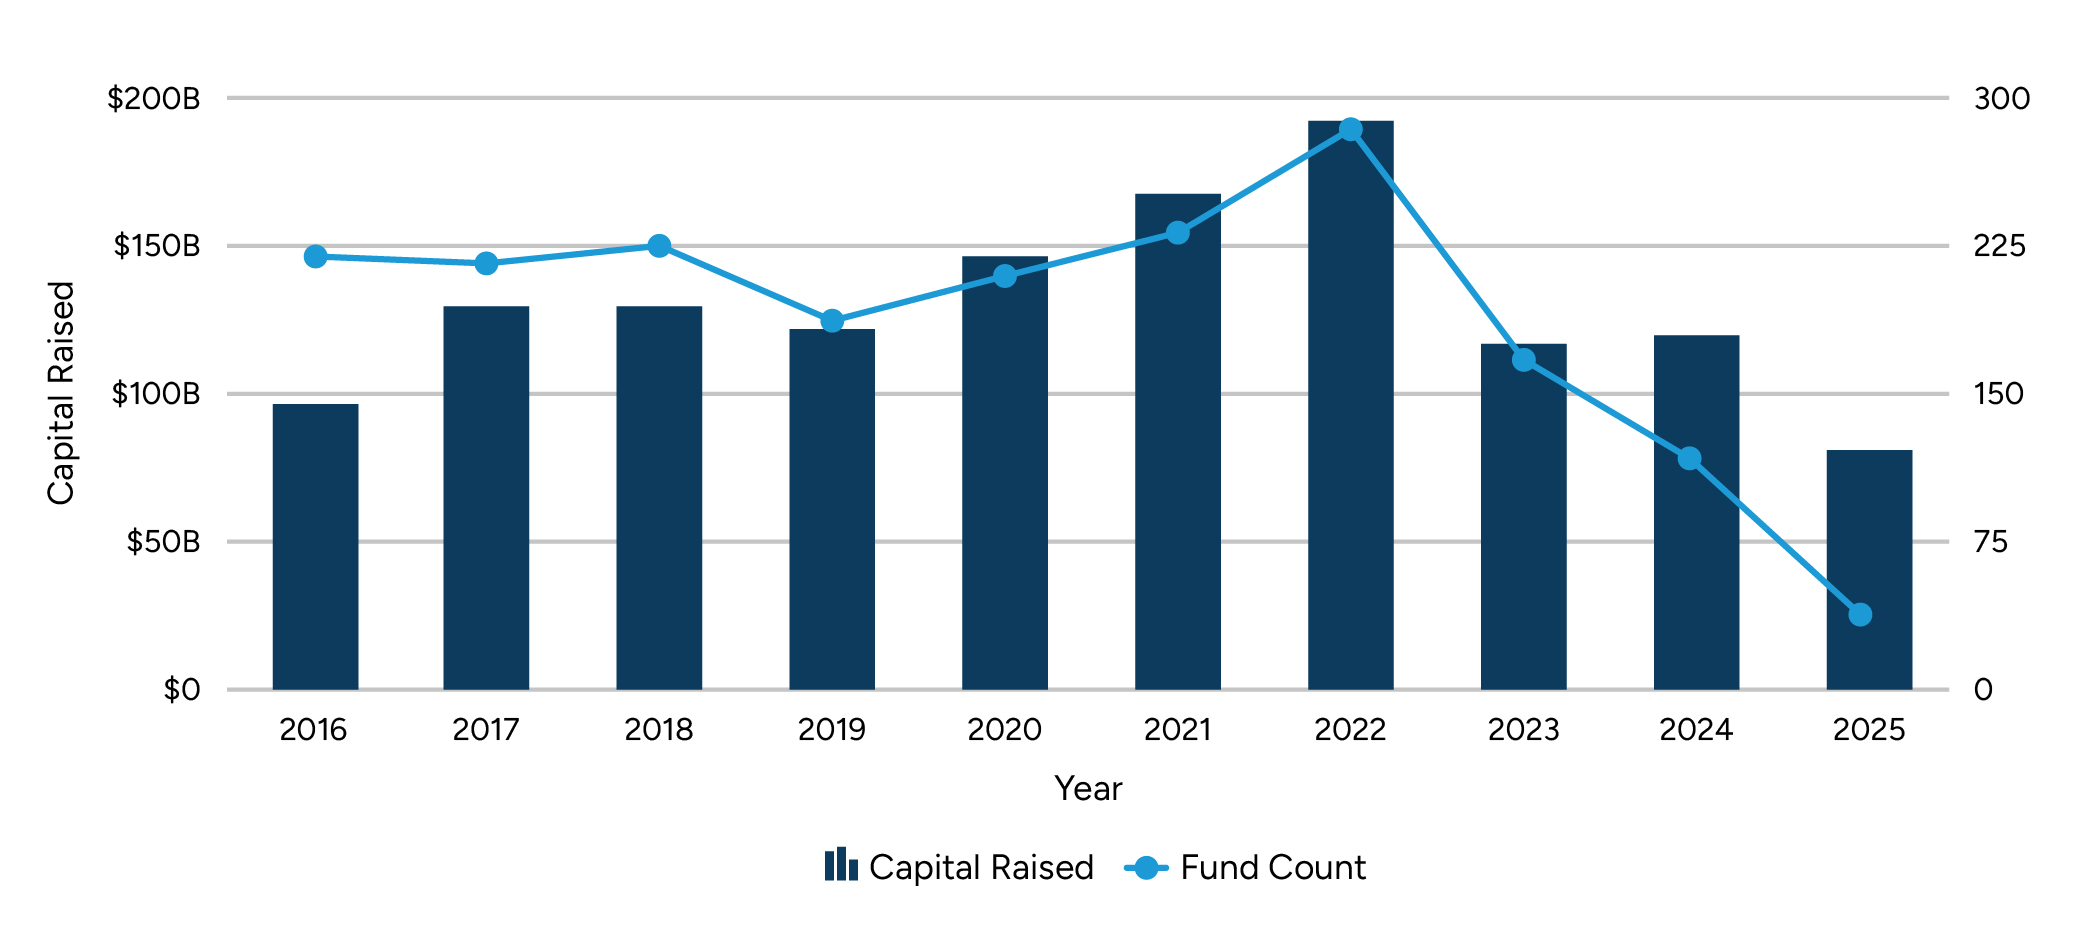
Source: Pitchbook – Represents funds focused on Real Assets, Natural Resources, & Infrastructure.
Note: 2025 represents YTD results as of May 31, 2025.
Stout is a global advisory firm specializing in corporate finance, accounting and transaction advisory, valuation, financial disputes, claims, and investigations. Our Energy group leverages deep advisory experience and expertise as well as dedicated coverage across a variety of business models and key industry subsectors. The team additionally maintains strong, tenured relationships with the most relevant private equity investors in addition to a long track record of success advising energy businesses in the middle market.
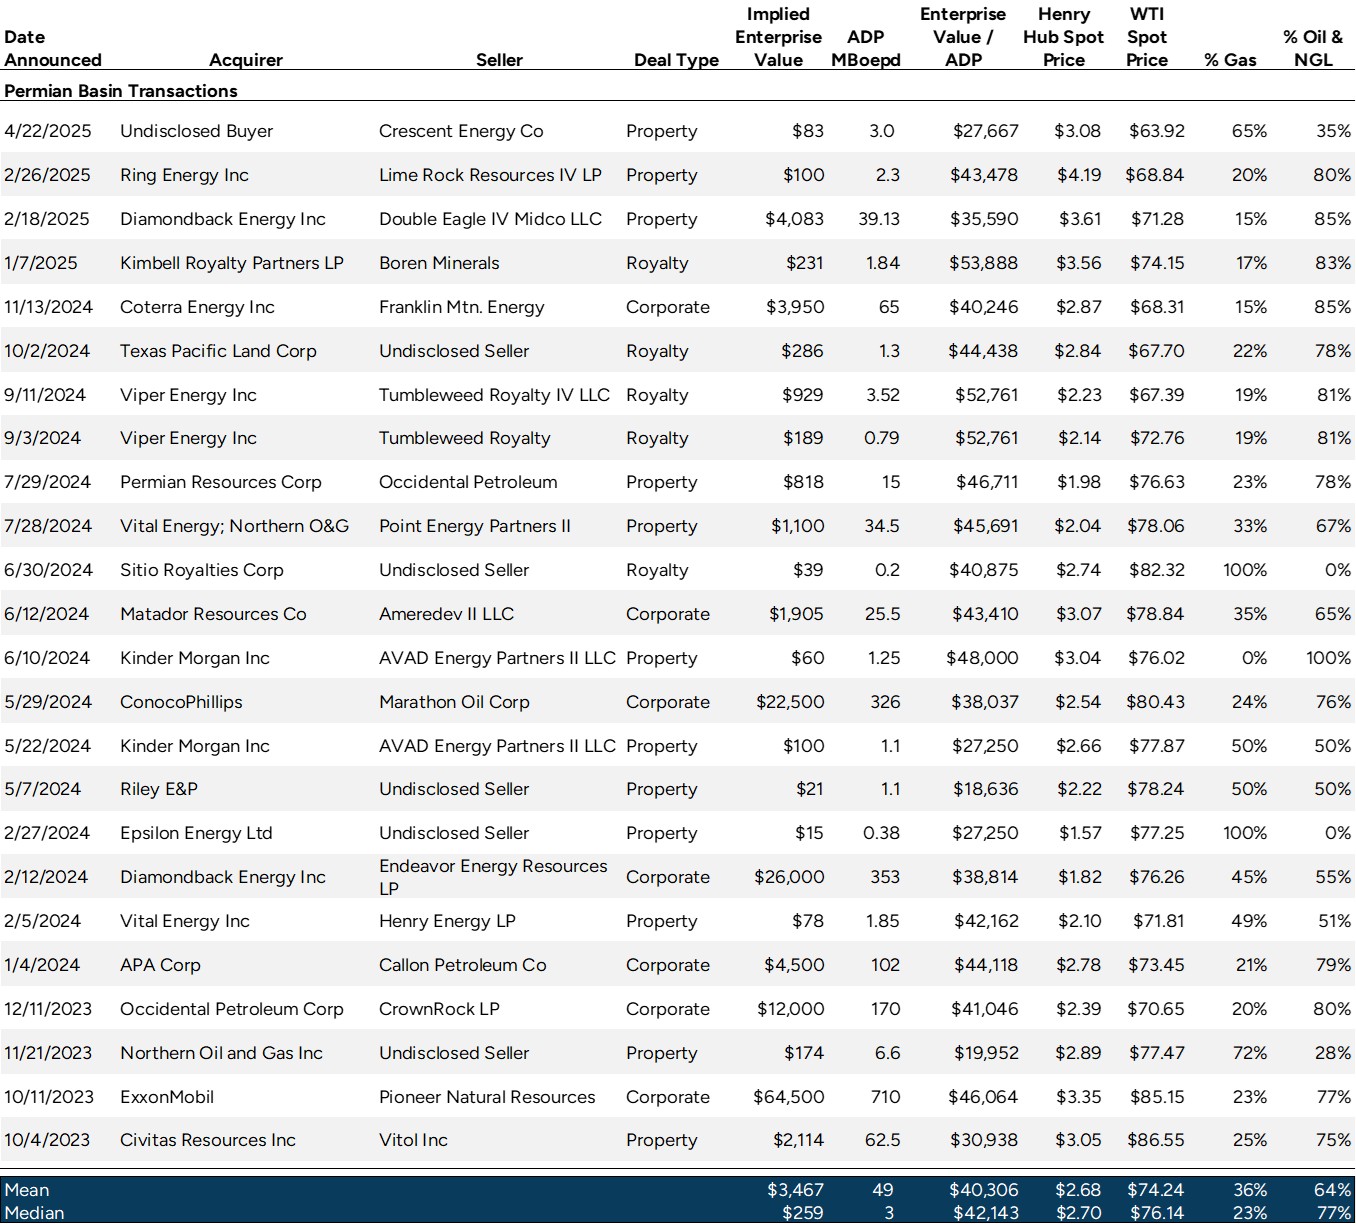
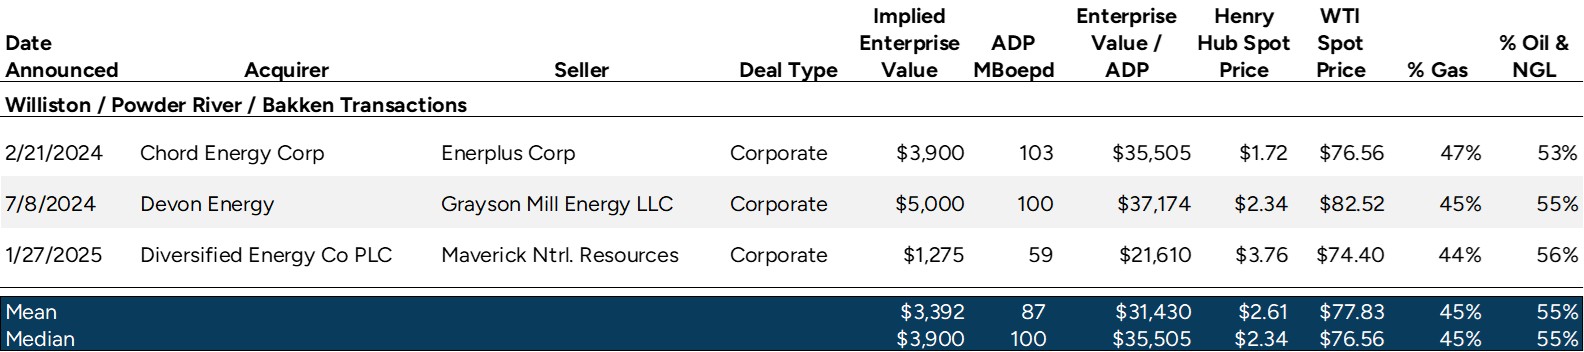
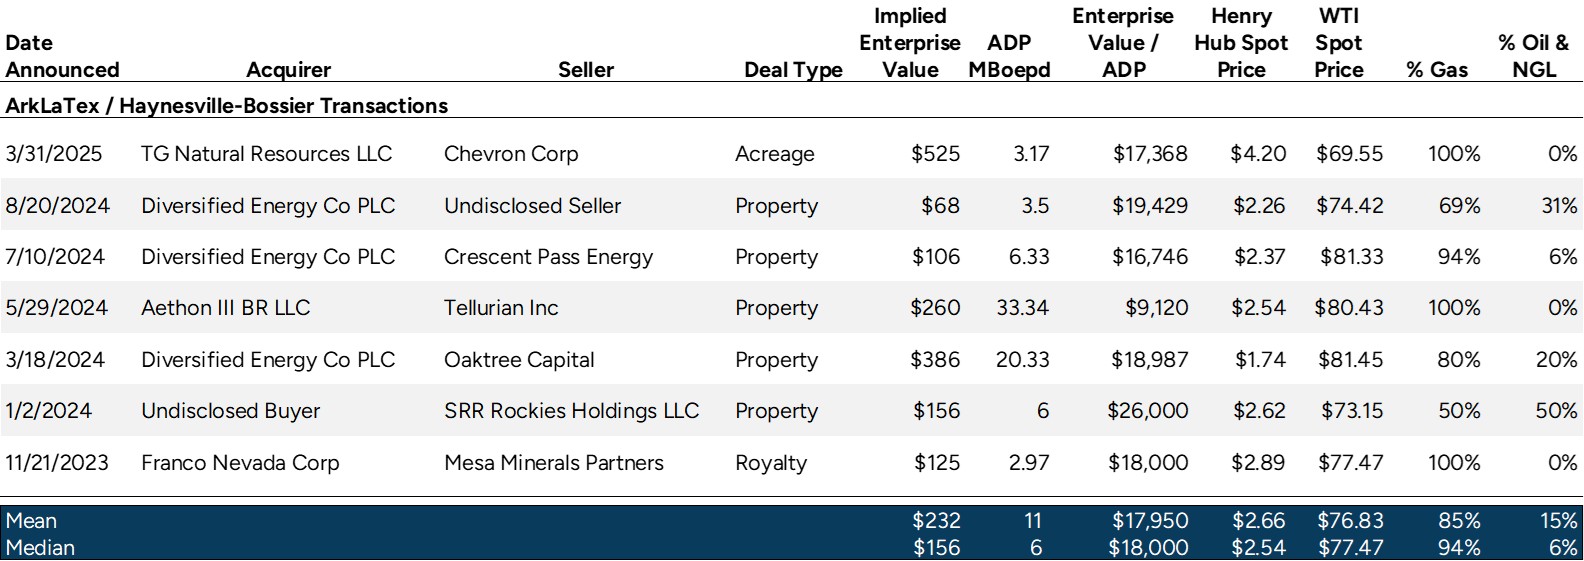
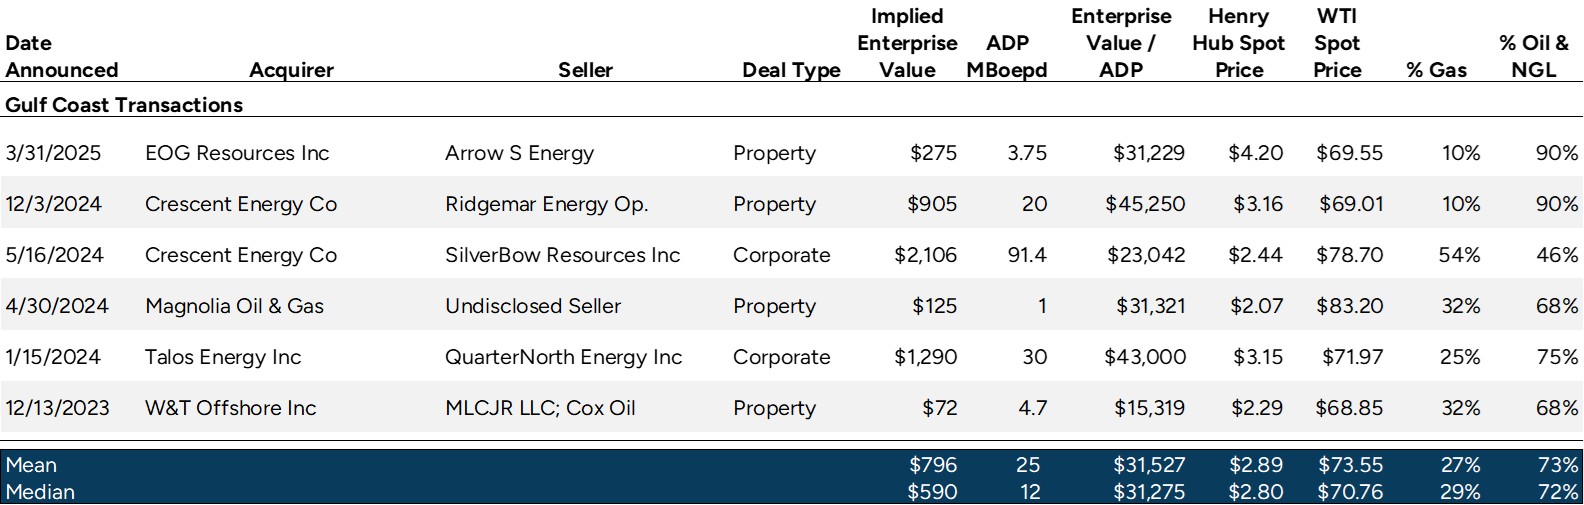
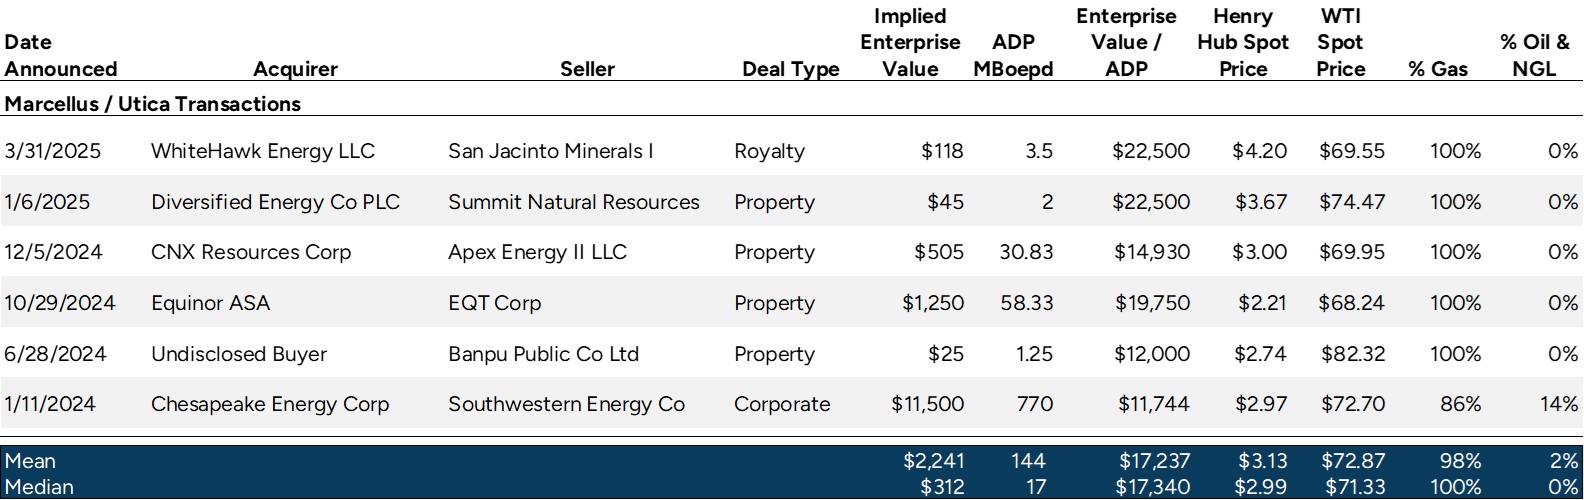
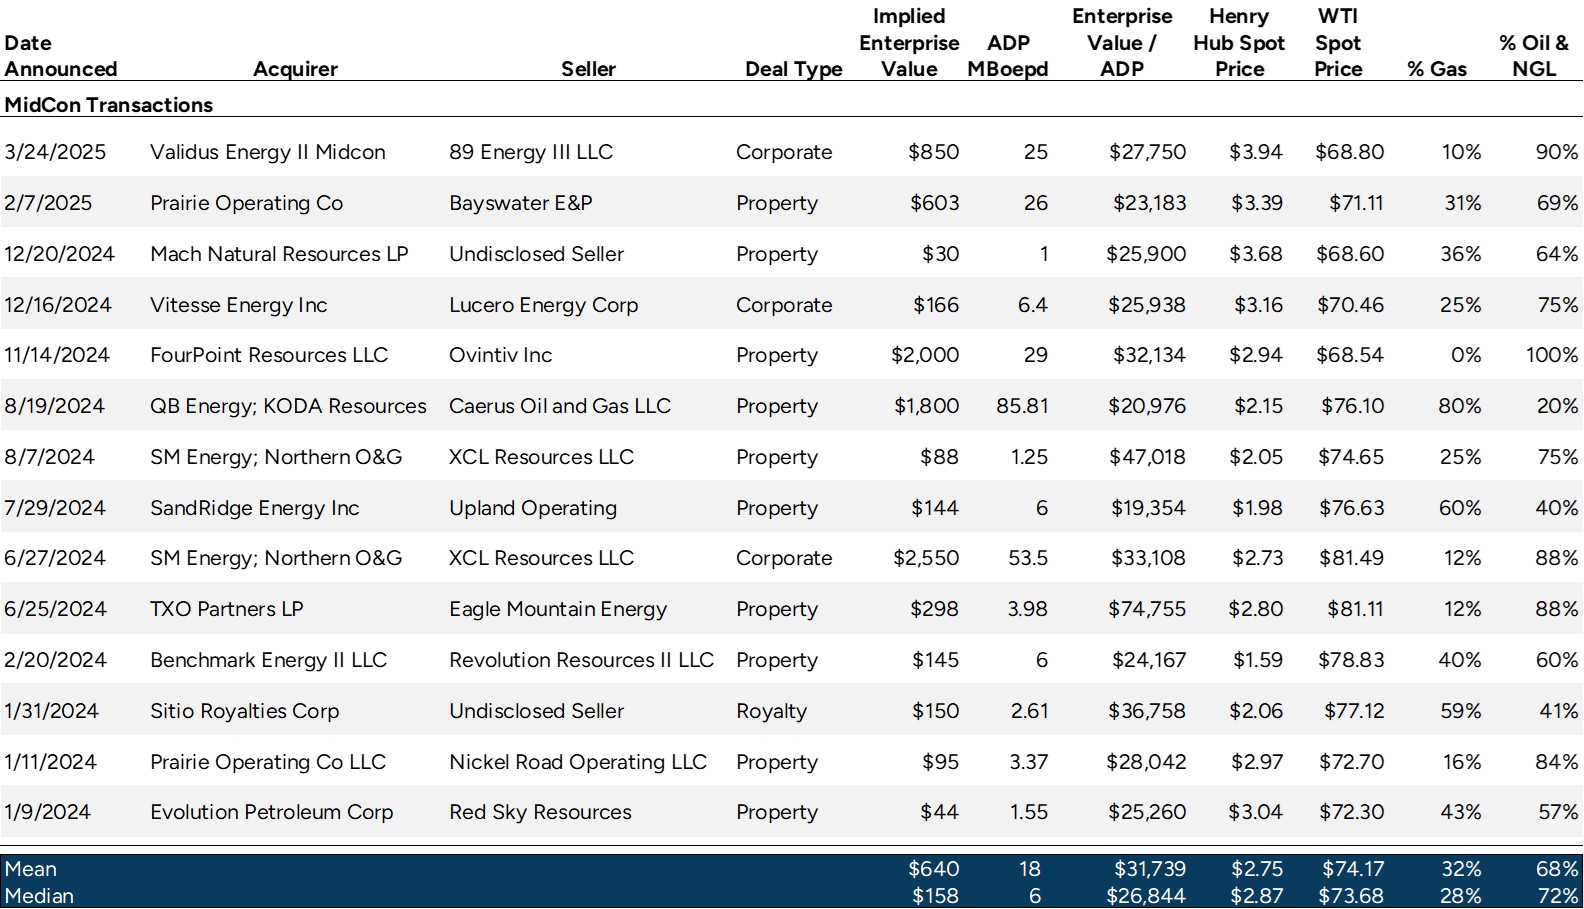
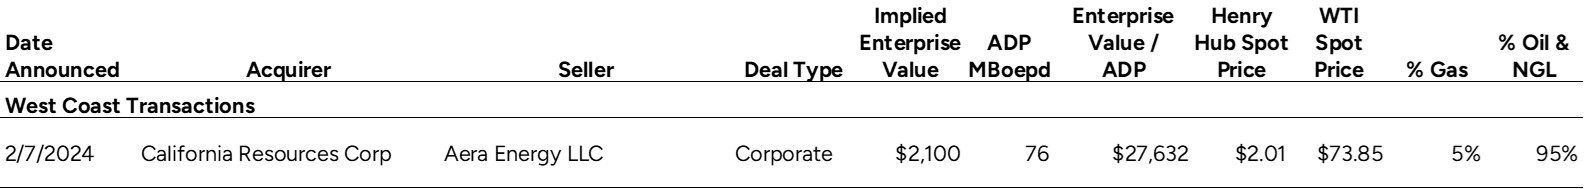
(dollars in millions of USD, production in thousands of boe)
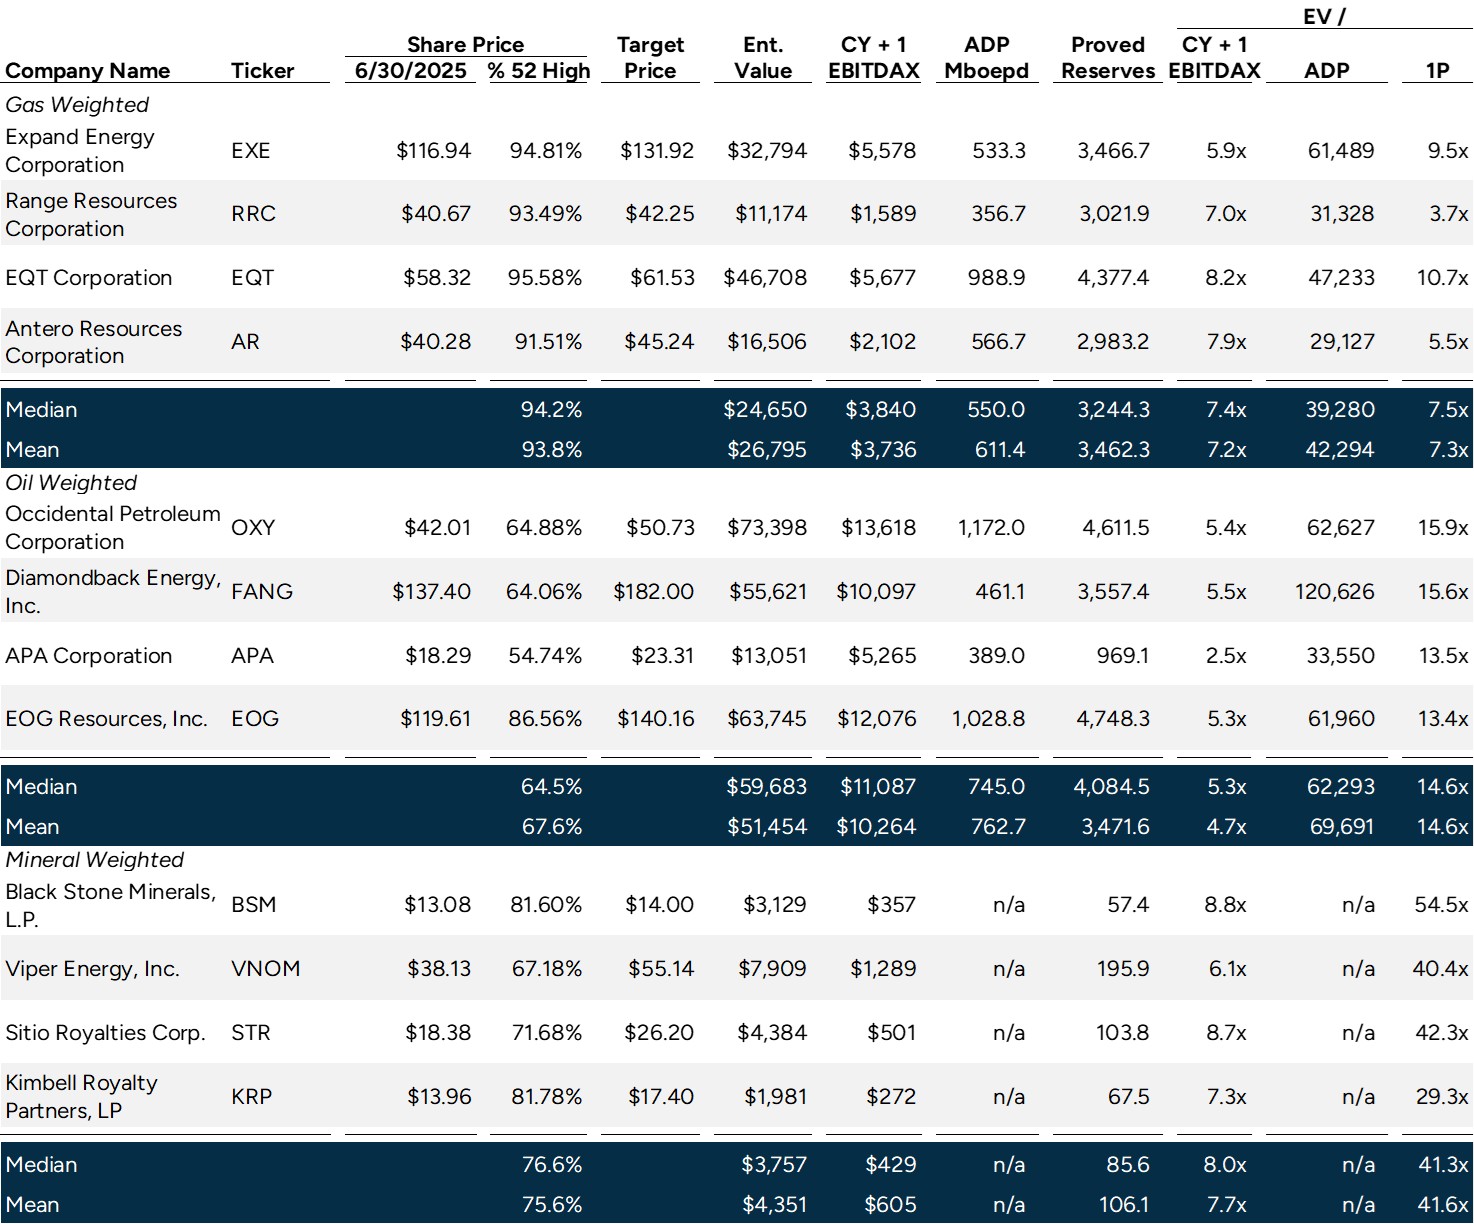
ADP refers to Average Daily Production.
EBITDAX refers to Earnings before Interest, Tax, Depreciation & Amortization, and Exploration Expense.
Source: S&P Capital IQ as of 5/31/2025.
ADP refers to Average Daily Production.
EBITDAX refers to Earnings before Interest, Tax, Depreciation & Amortization, and Exploration Expense.
Source: S&P Capital IQ as of 5/31/2025.
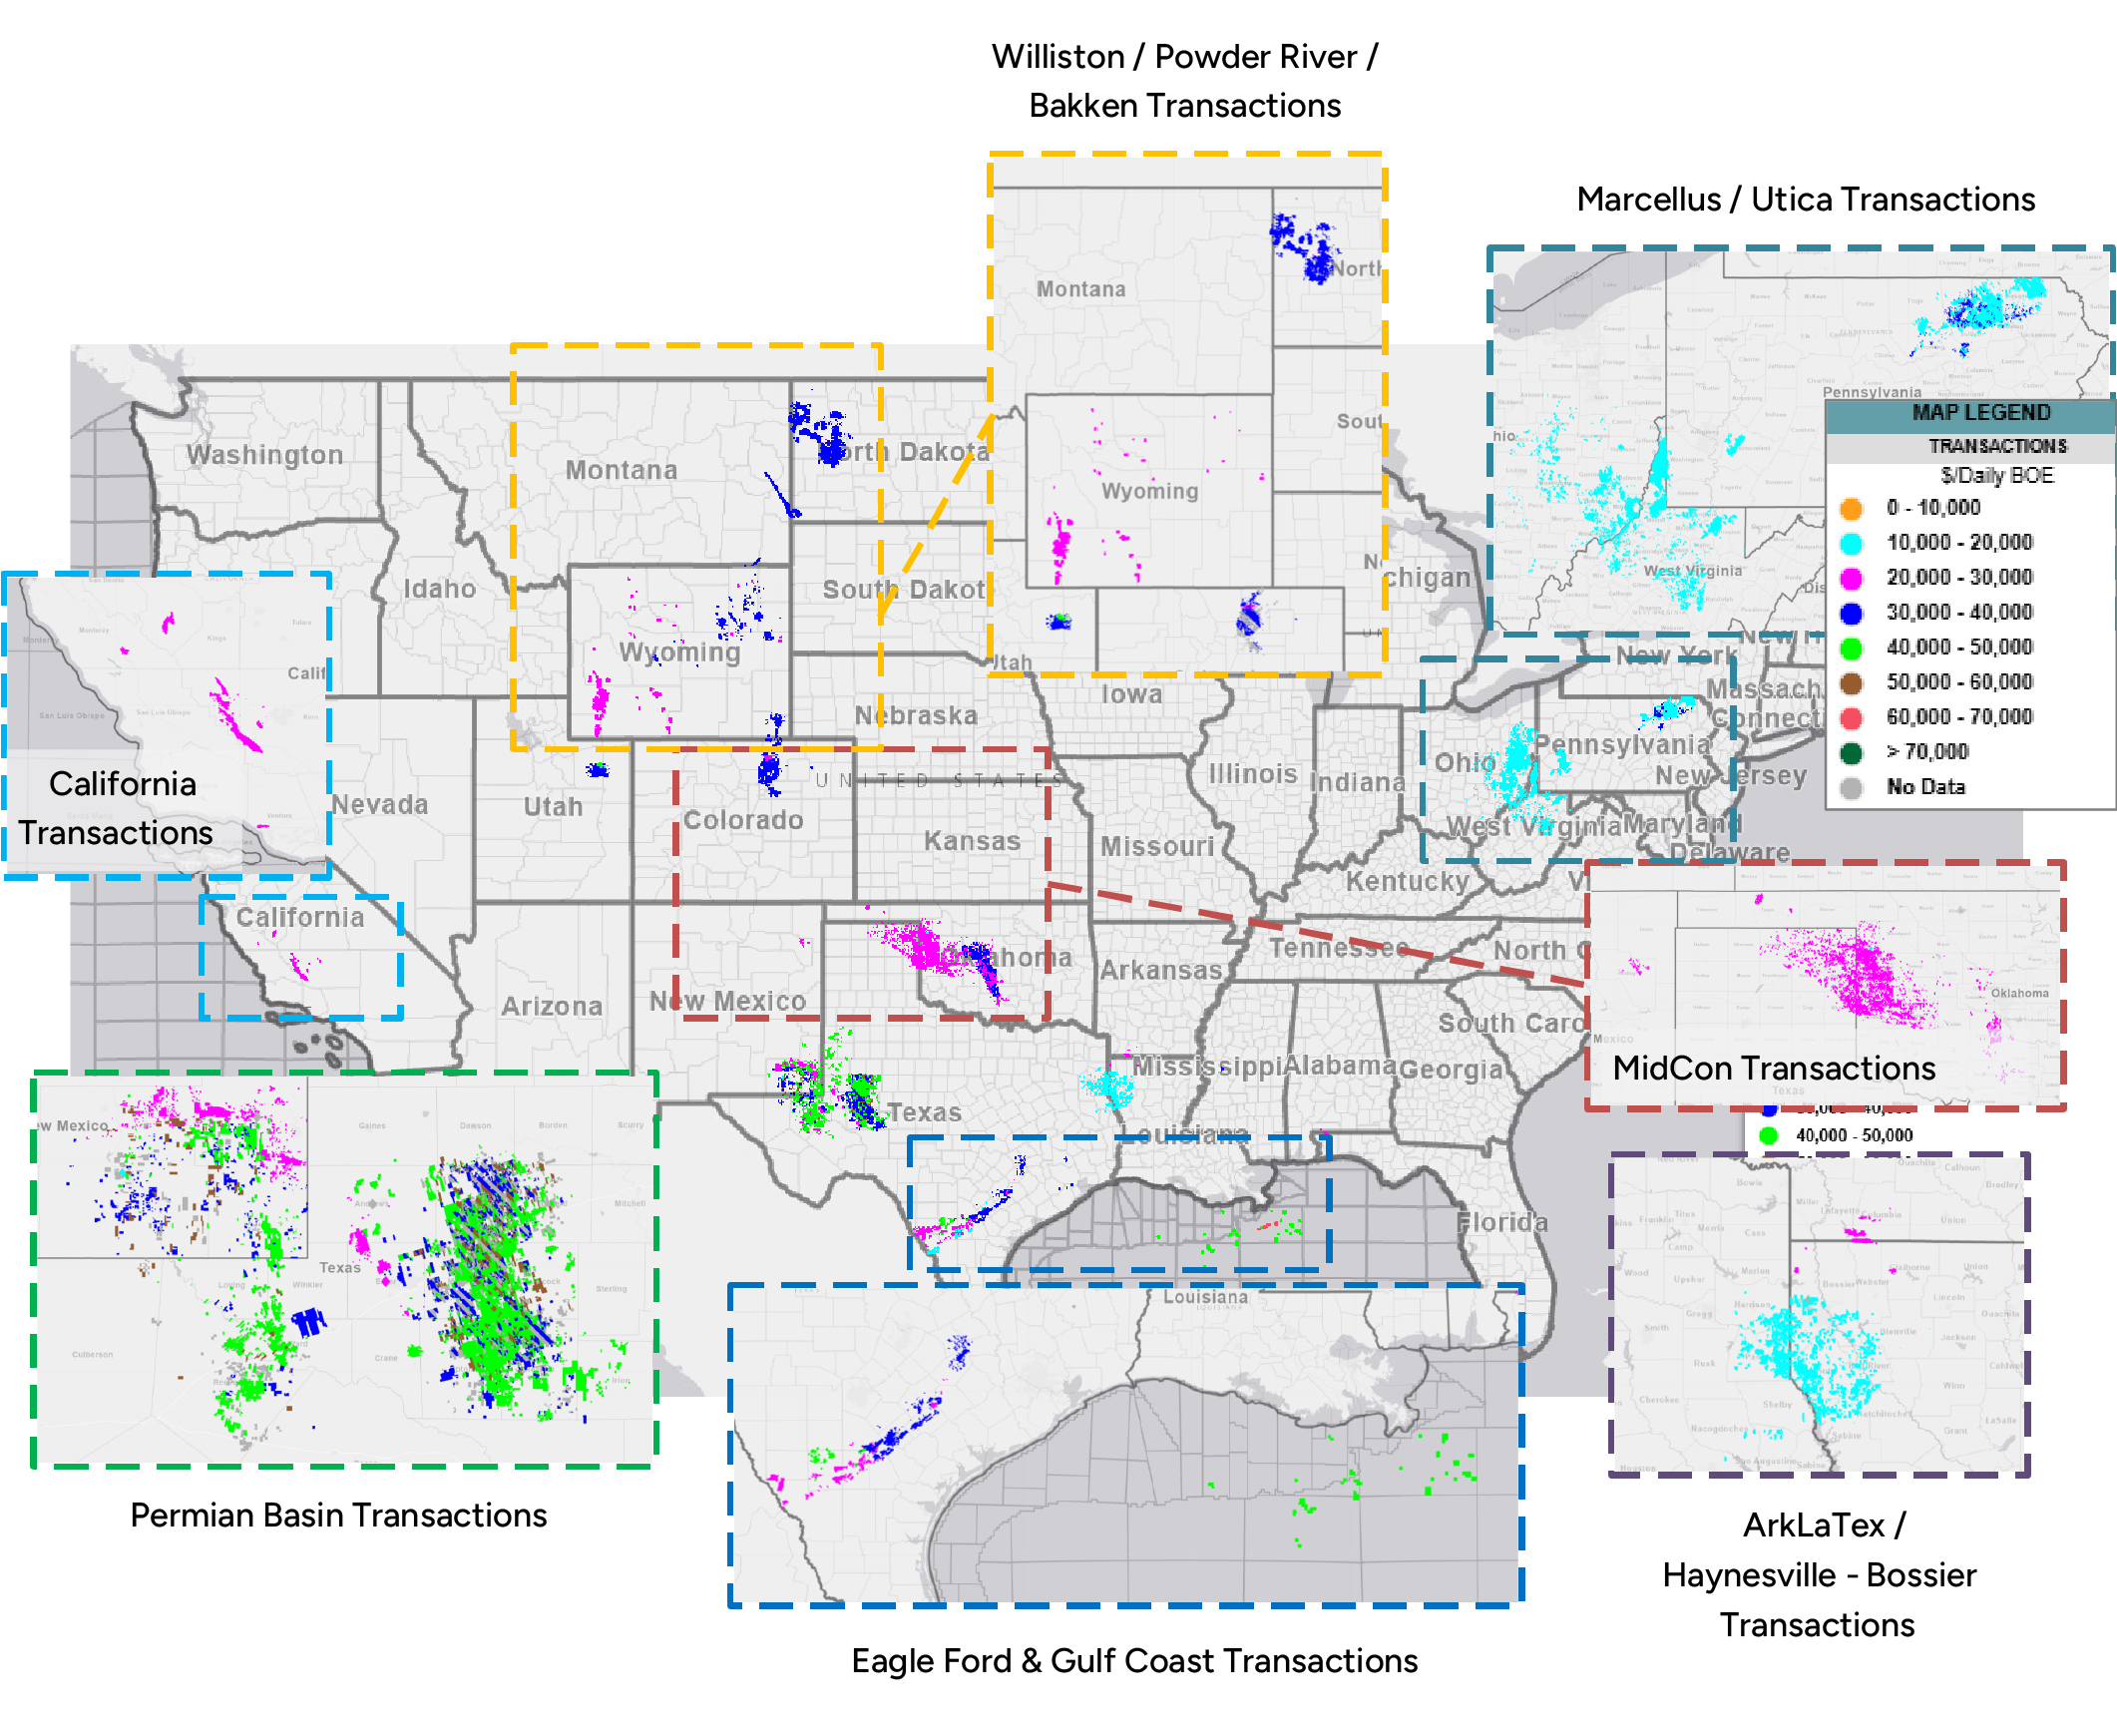
Source: Enverus
Source: Enverus
Source: Enverus
Source: Enverus
Source: Enverus
Source: Enverus
Source: Enverus
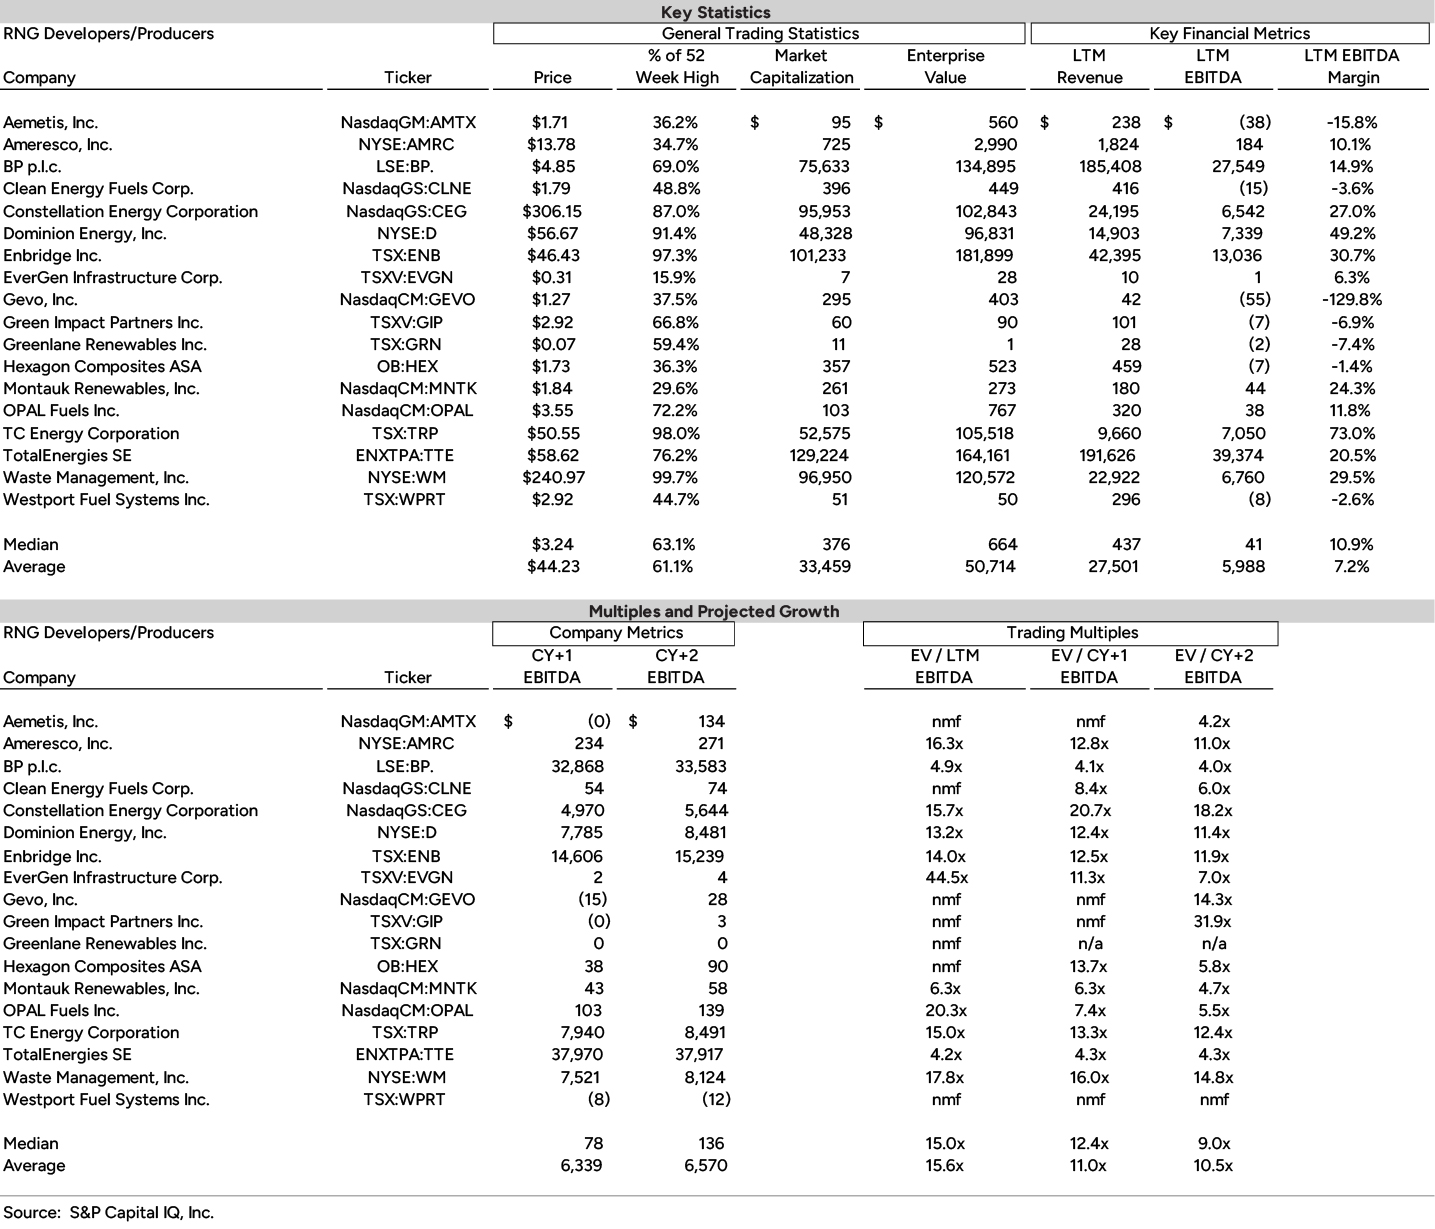
(dollars in millions of USD)
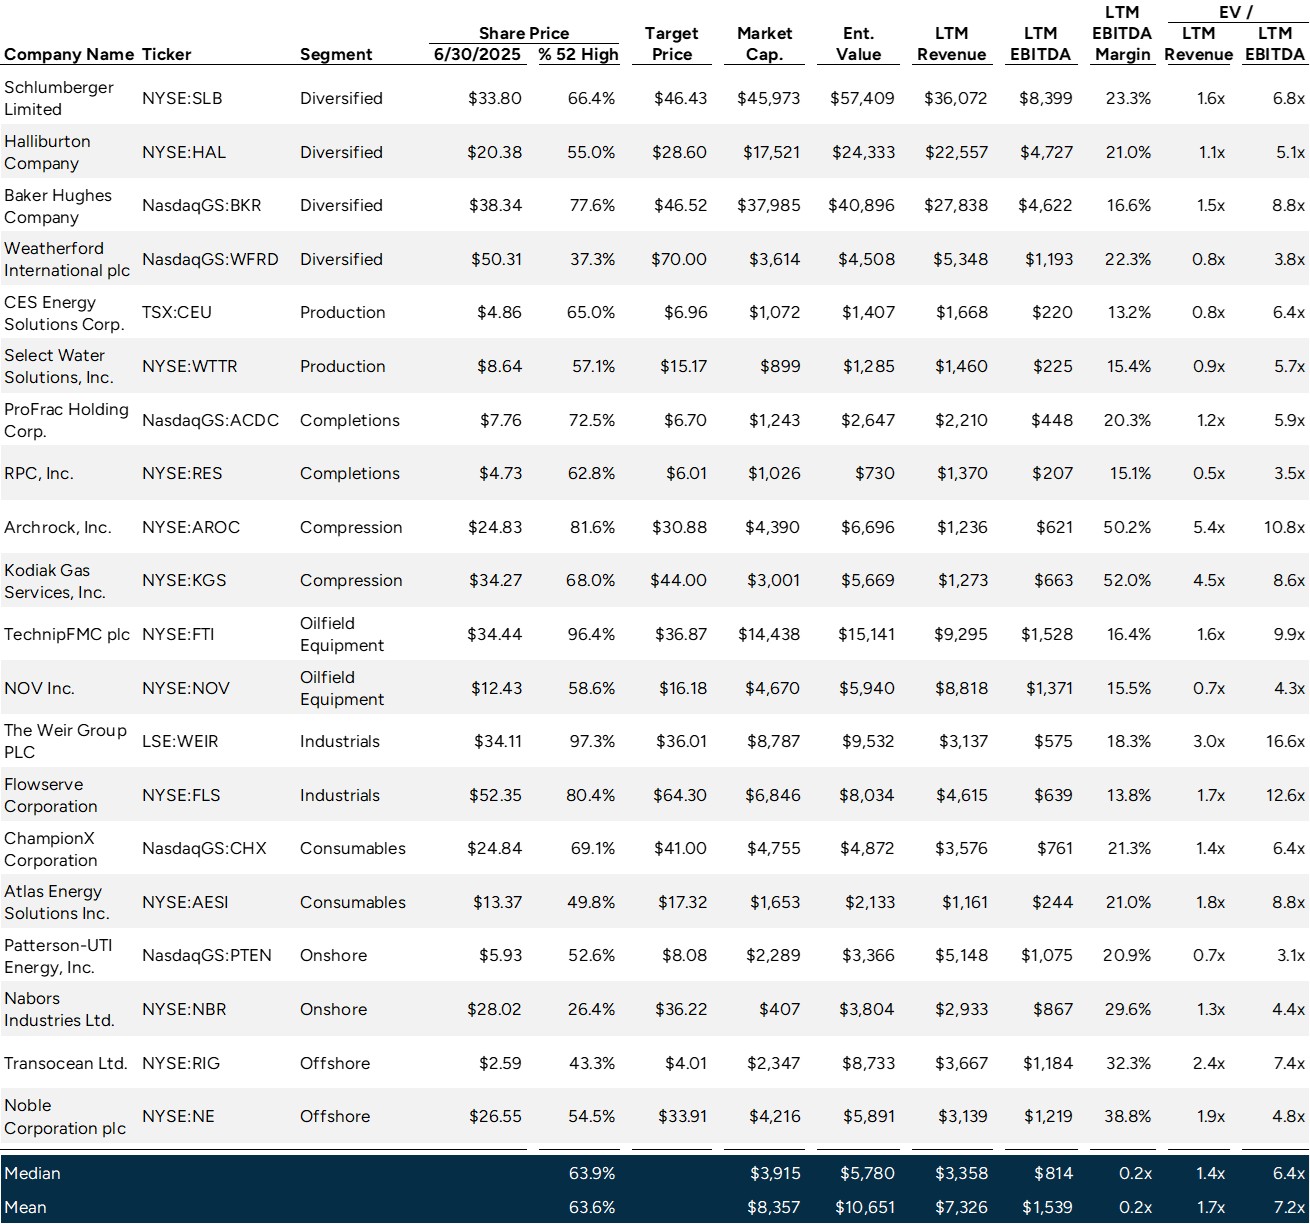
EBITDA refers to Earnings before Interest, Tax, Depreciation & Amortization.
Source: S&P Capital IQ as of 5/31/2025.
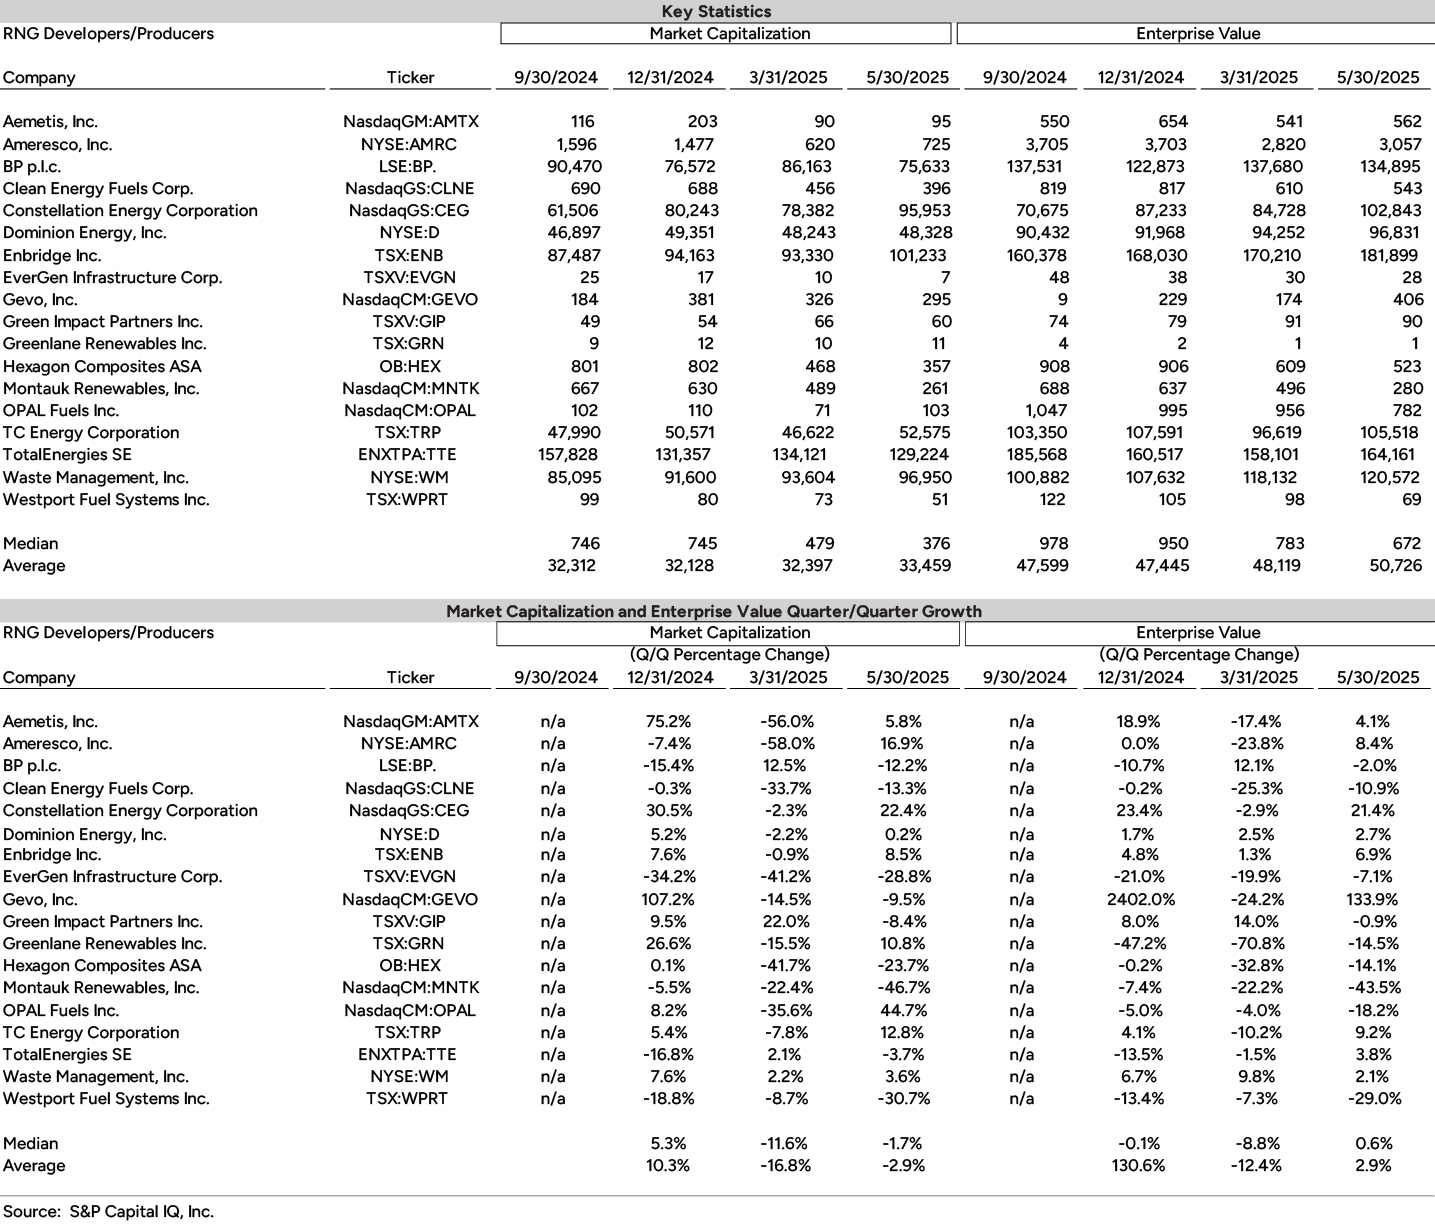
(dollars in millions of USD)
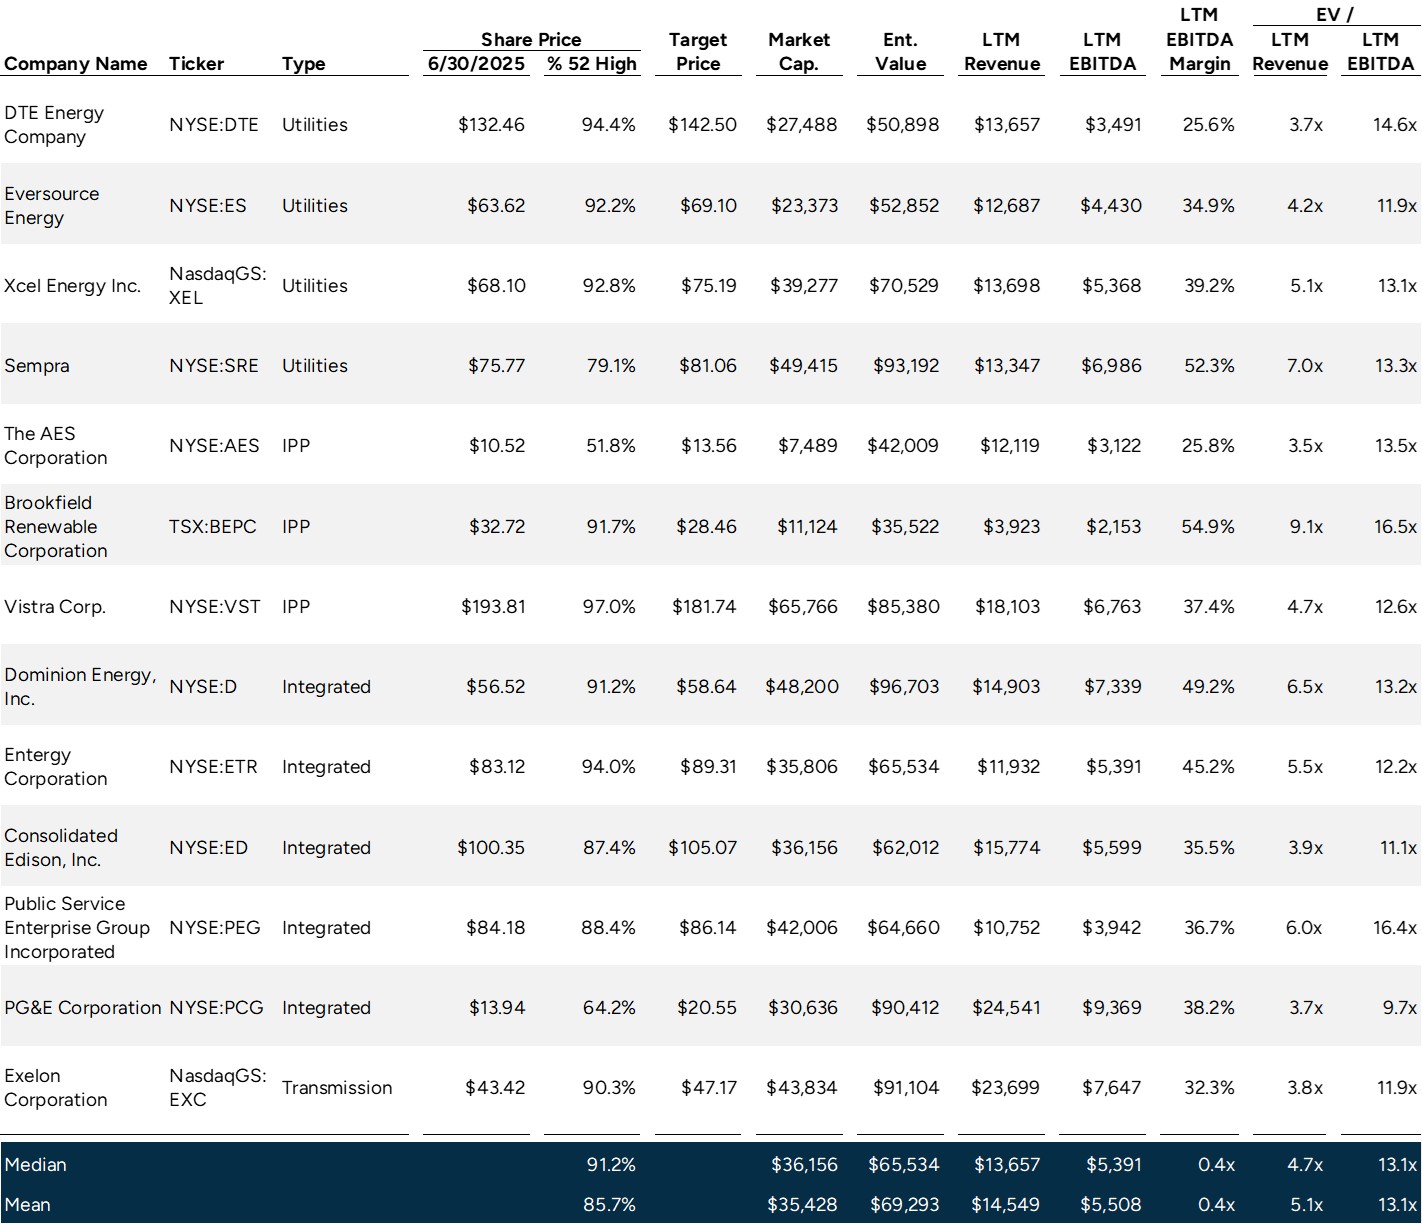
EBITDA refers to Earnings before Interest, Tax, Depreciation & Amortization.
Source: S&P Capital IQ as of 5/31/2025.
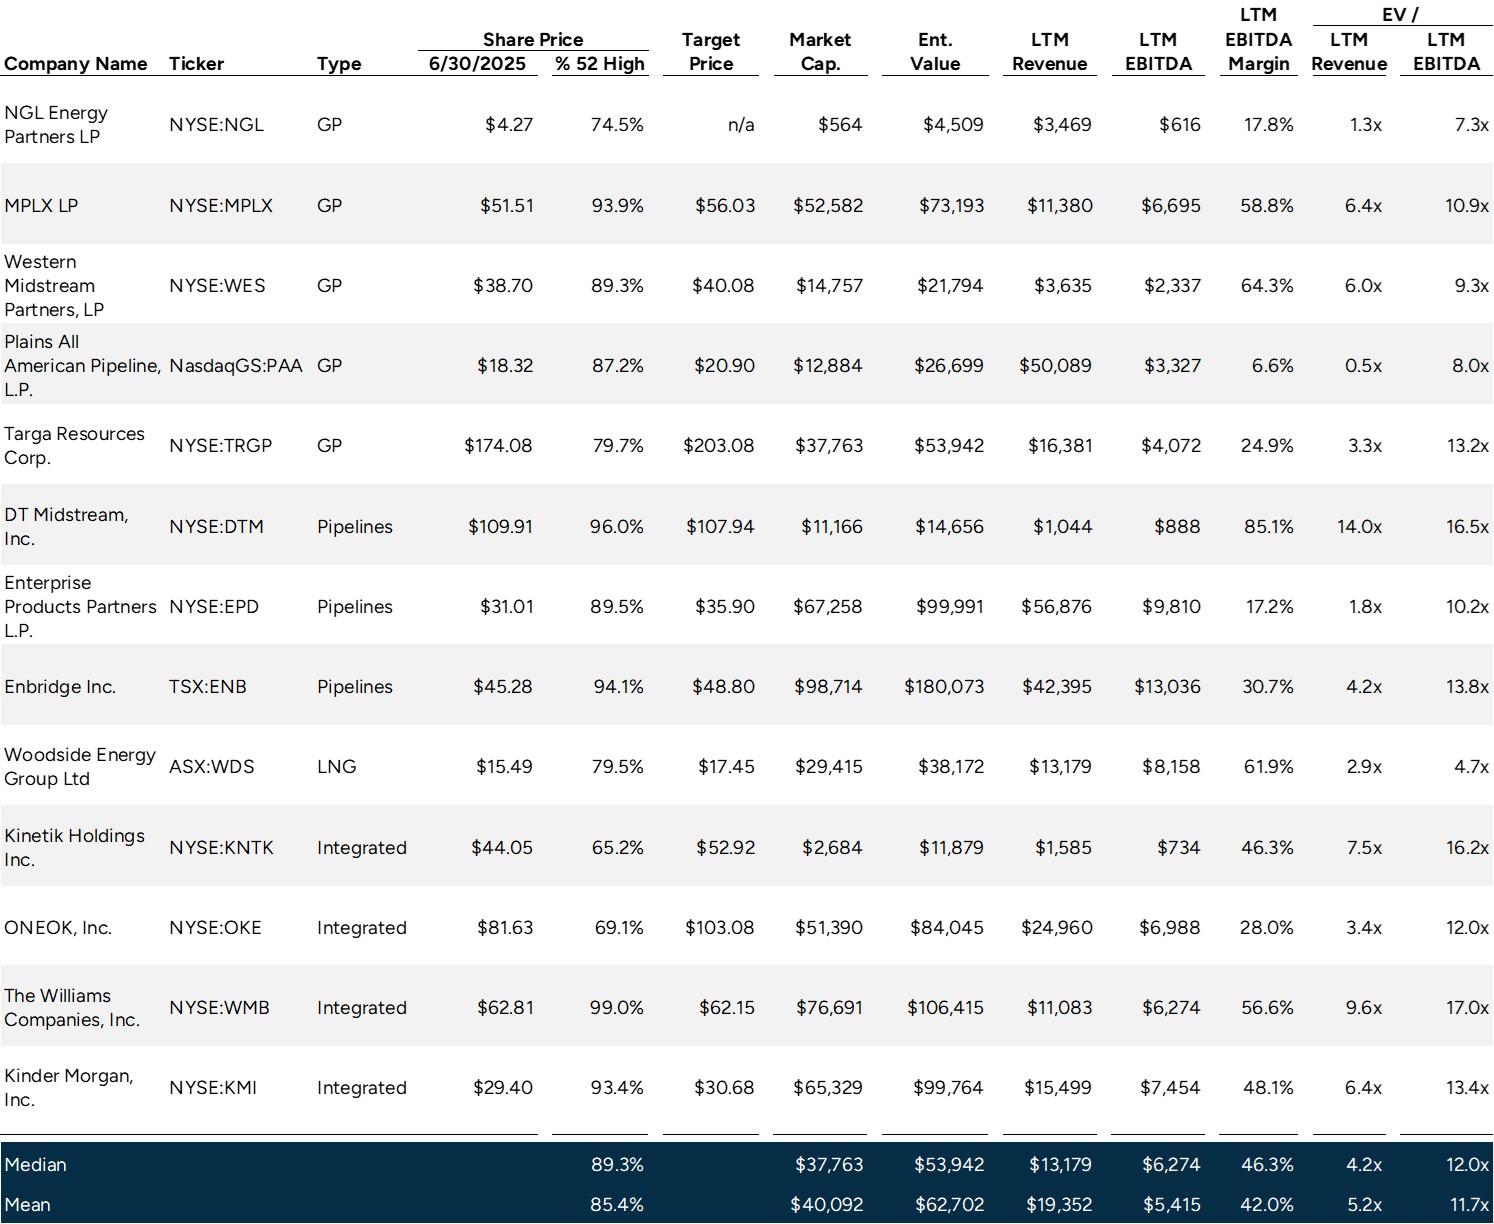
EBITDA refers to Earnings before Interest, Tax, Depreciation & Amortization.
Source: S&P Capital IQ as of 5/31/2025.